(2) Discrimination For The Pitch Of Tones #2
Description
This section is from the book "Human Vitality And Efficiency Under Prolonged Restricted Diet", by Francis G.BENEDICT, Walter R. Miles, Paul Roth, And H. Monmouth Smith. Also available from Amazon: Human Vitality and Efficiency Under Prolonged Restricted Diet.
(2) Discrimination For The Pitch Of Tones #2
Seashore and his collaborators1 have concluded as a result of a great deal of experimentation that the ability to discriminate the pitch of tones is elemental and the sensitiveness of the ear to pitch differences can not be improved appreciably by practice. They distinguish sharply between the cognative and physiological thresholds. The cognative threshold shows rapid improvement at first and approaches the physiological threshold just to that degree that the subject is able to grasp the nature of the test, to understand thoroughly what is required of him, remove subjective disturbances, expectations, and inhibitions, and to summon his best effort and most favorable attention to the discrimination of the pitch of the tones presented.
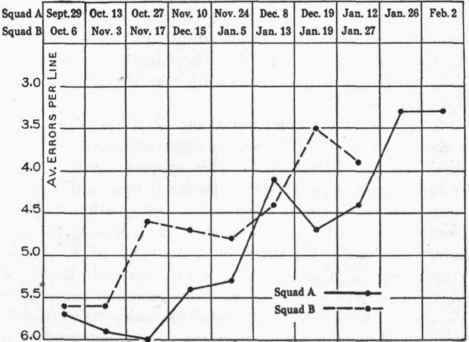
Fig. 102. - Errors inaccuracy of tracing between parallel lines.
1 Seashore, Psychological Monographs, 1910,13, p. 53; Smith, F. O. (Iowa Studies in Psychology, 6), Psychological Monographs, 1914, 16, pp. 67 to 103, particularly p. 101; Seashore and Mount (Iowa Studies in Psychology, 7), Psychological Monographs, 1918, 15, pp. 47 to 92; also, Seashore and Tan, ibid., pp. 159 to 163.
These experimenters believe that a 1-hour group test by the heterogeneous method (that is, a number of individuals who have not been classified in reference to their pitch discrimination ability, tested with a number of pitch differences ranging in size from 30 to 1 vd.,1 and each increment presented for judgment about an equal number of times) will reveal the approximate physiological threshold of about half of the subjects tested. The elimination of all objective disturbances, careful instruction, and the ingenuity of the experimenter count for much.
In using pitch discrimination as a measurement in the present research, it was not hoped to make an accurate determination of the physiological threshold of the subjects tested to ascertain if food reduction changed this physiological constant. The time would not permit of using the measurement in any other way than by the group method. In the first test with each squad pitch difference increments of 30, 23, 17, 12, 8, 5, 3, 2, and 1 vd. lower than 435 vd. were employed. The test lasted about one-half hour. Judging by previous experience with pitch discrimination measurements, the conditions were favorable. Nearly all the subjects were able to discriminate, without error, differences above 8 vd. In succeeding tests it was therefore possible to confine the judgments to intervals of 8, 5,3, 2, and 1 vd. It would have been possible also to have omitted the increment of 8 vd., since nearly all subjects show from 90 to 100 per cent correct judgment with this pair of tuning forks. It was, however, advantageous to use this increment in the test because of the easy assurance with which the subject was able to judge between these tones. This gave confidence for the more difficult judgments.
In tables 149 and 150 for Squads A and B, respectively, the percentages of correct judgments are given for the pitch increments 5, 3,2, and 1 vd.2 The tables are of the same general form as those given for steadiness of tracing. Thus in table 149 Bro on October 13 shows 97 per cent correct judgment with a pitch difference of 5 vd., 90 per cent with a difference of 3, 80 per cent for 2, and 63 per cent for a difference of 1 vd. This was the second trial in pitch discrimination for this subject, and his record shows considerable improvement for the same pitch increments over his trial on September 29, when, as described, the larger increments were used and fewer trials were made with each. There are a large number of values scattered through the table that show 100 per cent correct judgment. These are usually with increments of 5 and 3 vd. Gul had a final average (see average at bottom of table 149) of 100 per cent correct judgment with 5 vd., 99 per cent with 3, with 91 per cent and 77 per cent for 2 and 1 vd., respectively. Conventionally, the pitch discrimination threshold is considered to be that difference or increment which shows 75 per cent of correct judgment. According to this, Gul's threshold was 1 vd. or slightly below. Gar also shows 77 per cent at 1 vd. His record, however, is not so consistent, since he showed 77 per cent also for 2 vd. Other average records which are particularly good are with subjects Pea, Pec, and Bro, all of whom have thresholds below 2 vd. Kon, Tom, and Yea show almost exactly 75 per cent on 2 vd. The values for Mon, since they frequently show less than 50 per cent correct judgments, were in the case of pitch discrimination not included in the averages which are for the other 9 regular subjects and appear at the right of the table. The total average for all records, excluding September 29 (normal), shows 95, 88, 77, and 67 per cent correct judgment for pitch-difference intervals 5, 3, 2, and 1 vd., respectively. The average threshold is evidently very close to 2 vd., which corresponds absolutely with the modal threshold found by Seashore from records on about 800 undergraduate college students, including both men and women.
1 Double vibrations.
2 It appeared unnecessary to include the results for 8 vd., as the percentage of correct judgments with this interval was usually well above 90.
Table 149. - Squad A - Percentage Of Correct Judgments In Pitch Discrimination
Date. | Intervals. | Bro. | Can. | Kon. | Gar. | Gul. | Mon.1 | Moy. | Pea. | Pec. | Spe. | Tom. | Vea. | Fre. | Av.1 |
1917. | vd. | ||||||||||||||
Sept. 29. . | 5 | 70 | 70 | 90 | 80 | 100 | 70 | 100 | 80 | 90 | 90 | 100 | 90 | 100 | 87 |
3 | 50 | 80 | 60 | 60 | 80 | 50 | 50 | 70 | 80 | 50 | 60 | 60 | 50 | 66 | |
2 | 70 | 80 | 50 | 60 | 90 | 70 | 70 | 70 | 50 | 80 | 50 | 60 | 50 | 67 | |
1 | 40 | 40 | 50 | 60 | 40 | 50 | 40 | 30 | 60 | 40 | 70 | 50 | 30 | 48 | |
Oct. 13.. | 5 | 97 | 80 | .. | 90 | 100 | 63 | 87 | 93 | 100 | 97 | 97 | 93 | 100 | 93 |
3 | 90 | 70 | .. | 90 | 97 | 67 | 90 | 87 | 93 | 87 | 83 | 80 | 80 | 87 | |
2 | 80 | 63 | .. | 63 | 80 | 50 | 70 | 70 | 53 | 57 | 77 | 73 | 67 | 70 | |
1 | 63 | 57 | .. | 47 | 60 | 47 | 50 | 73 | 60 | 53 | 60 | 60 | 67 | 59 | |
0ct. 27.. | 5 | 100 | 77 | 93 | 97 | 100 | 80 | 80 | 100 | 97 | 97 | 90 | 90 | .. | 92 |
3 | 97 | 73 | 77 | 93 | 100 | 27 | 87 | 87 | 97 | 97 | 83 | 83 | .. | 89 | |
2 | 77 | 80 | 60 | 77 | 93 | 47 | 73 | 80 | 87 | 87 | 73 | 70 | .. | 79 | |
1 | 57 | 73 | 53 | 83 | 87 | 40 | 77 | 83 | 83 | 83 | 67 | 53 | .. | 74 | |
Nov. 10.. | 5 | 100 | 83 | 100 | 100 | 100 | 60 | 83 | 100 | 90 | 100 | 100 | 97 | ... | 95 |
3 | 97 | 80 | 83 | 97 | 100 | 60 | 80 | 100 | 93 | 97 | 100 | 87 | .. | 93 | |
2 | 93 | 60 | 70 | 80 | 97 | 43 | 53 | 90 | 63 | 93 | 90 | 83 | .. | 79 | |
1 | 77 | 83 | 63 | 83 | 93 | 37 | 43 | 83 | 67 | 83 | 83 | 67 | .. | 75 | |
Nov. 24.. | 5 | 100 | 90 | 100 | 97 | 100 | 27 | 100 | 100 | 97 | 97 | 97 | 97 | .. | 98 |
3 | 97 | 87 | 87 | 100 | 100 | 47 | 83 | 100 | 100 | 100 | 87 | 67 | .. | 91 | |
2 | 90 | 73 | 77 | 97 | 100 | 37 | 70 | 83 | 87 | 83 | 87 | 80 | .. | 85 | |
1 | 67 | 73 | 63 | 97 | 83 | 23 | 63 | 70 | 90 | 63 | 70 | 53 | .. | 74 | |
Dec. 8.. | 5 | 100 | 83 | 90 | 93 | 100 | 40 | 97 | 100 | 100 | 100 | 100 | 100 | .... | 97 |
3 | 97 | 63 | 80 | 90 | 97 | 20 | 83 | 90 | 100 | 97 | 80 | 73 | .. | 86 | |
2 | 73 | 77 | 80 | 73 | 100 | 23 | 60 | 70 | 93 | 97 | 77 | 77 | ... | 78 | |
1 | 53 | 67 | 57 | 80 | 73 | 30 | 53 | 70 | 63 | 87 | 53 | 53 | .. | 63 | |
Dec. 19.. | 5 | 97 | 63 | 97 | 100 | 100 | 63 | 97 | 97 | 97 | .. | 97 | 87 | .. | 93 |
3 | 93 | 73 | 93 | 93 | 100 | 43 | 87 | 93 | 90 | .. | 63 | 80 | .. | 86 | |
2 | 90 | 77 | 80 | 90 | 93 | 40 | 70 | 83 | 57 | ..___ | 77 | 60 | .. | 77 | |
1 | 60 | 53 | 53 | 67 | 77 | 27 | 50 | 67 | 63 | .. | 57 | 50 | 60 | ||
1918. | |||||||||||||||
Jan. 12. . | 5 | 97 | 90 | 100 | 90 | 100 | 83 | 87 | 100 | 97 | .. | 97 | 100 | .. | 95 |
3 | 90 | 73 | 87 | 77 | 100 | 50 | 73 | 93 | 90 | .. | 70 | 80 | .. | 83 | |
2 | 67 | 67 | 83 | 83 | 93 | 60 | 63 | 87 | 87 | . | 60 | 67 | .. | 75 | |
1 | 70 | 47 | 57 | 70 | 70 | 40 | 57 | 67 | 80 | ... | 53 | 57 | ... | 63 | |
Jan. 26.. | 5 | 97 | 87 | 97 | 97 | 97 | 50 | 87 | 97 | 90 | .. | 100 | 97 | .... | 94 |
3 | 90 | 87 | 93 | 93 | 97 | 40 | 90 | 90 | 93 | .. | 60 | 70 | .. | 86 | |
2 | 83 | 50 | 83 | 73 | 83 | 53 | 70 | 77 | 87 | .. | 60 | 63 | .. | 72 | |
1 | 63 | 63 | 43 | 83 | 70 | 40 | 60 | 80 | 70 | .. | 53 | 53 | .. | 66 | |
Feb. 2.. | 5 | 100 | 80 | 100 | 93 | 100 | 60 | 83 | 100 | 97 | ... | 97 | 100 | ... | 94 |
3 | 100 | 87 | 90 | 93 | 97 | 43 | 87 | 100 | 90 | .. | 90 | 87 | .. | 92 | |
2 | 87 | 43 | 83 | 60 | 97 | 60 | 63 | 80 | 80 | .. | 67 | 87 | .. | 74 | |
1 | 73 | 60 | 57 | 80 | 77 | 37 | 60 | 90 | 77 | .... | 63 | 60 | .. | 71 | |
Low-diet av2 | 5 | 99 | 81 | 97 | 95 | 100 | 58 | 89 | 99 | 96 | 98 | 97 | 96 | 100 | 95 |
3 | 95 | 63 | 83 | 92 | 99 | 44 | 84 | 93 | 94 | 91 | 79 | 79 | 80 | 88 | |
2 | 82 | 66 | 74 | 77 | 91 | 46 | 66 | 80 | 77 | 83 | 74 | 73 | 67 | 77 | |
1 | 65 | 64 | 55 | 77 | 77 | 36 | 57 | 76 | 73 | 74 | 62 | 56 | 67 | 67 | |
1 Records for Mon show low and irregular values and were not included in the average which also excludes Kon, Spe, and Fre. 2 Sept. 29 (normal) not included in this average.
Table 150. - Squad B - Percentage Of Correct Judgments In Pitch Discrimination
Date. | Intervals. | Fis. | Har. | How. | Ham. | McM. | Kim. | Lon. | Mac. | Sen. | Liv. | Sne. | Tho. | Van.1 | Wil. | Av.1 |
1917. | vd. | |||||||||||||||
Oct. 6.. | 5 | 70 | 80 | 60 | 90 | .. | .. | 80 | 90 | .. | 80 | 80 | 90 | 80 | 100 | 81 |
3 | 70 | 80 | 80 | 50 | ... | .. | 40 | 70 | .. | 70 | 90 | 90 | 60 | 100 | 74 | |
2 | 70 | 70 | 60 | 80 | .. | .. | 60 | 60 | .. | 60 | 60 | 80 | 50 | 90 | 70 | |
1 | 60 | 40 | 60 | 50 | .. | . | 40 | 40 | ... | 60 | 60 | 70 | 10 | 80 | 57 | |
Nov. 3.. | 5 | 90 | 80 | 87 | 90 | 77 | .. | 93 | 87 | .. | 83 | 93 | 100 | 43 | 100 | 91 |
3 | 83 | 93 | 73 | 83 | 70 | .. | 87 | 87 | .. | 67 | 77* | 97 | 17 | 100 | 84 | |
2 | 77 | 77 | 50 | 53 | 87 | .. | 67 | 70 | ... | 57 | 70 | 90 | 30 | 83 | 69 | |
1 | 63 | 57 | 40 | 53 | 60 | .. | 47 | 60 | .. | 50 | 60 | 67 | 33 | 83 | 58 | |
Nov. 17.. | 5 | 97 | 90 | 90 | 97 | 47 | . | 100 | 97 | .. | 87 | 100 | 100 | 70 | 100 | 96 |
3 | 87 | 93 | 80 | 80 | 47 | . | 83 | 93 | .. | 83 | 93 | 97 | 40 | 100 | 88 | |
2 | 67 | 77 | 73 | 73 | 50 | . | 70 | 67 | . | 70 | 83 | 93 | 33 | 90 | 77 | |
1 | 50 | 73 | 43 | 43 | 37 | ... | 47 | 40 | ... | 43 | 57 | 67 | 37 | 87 | 57 | |
Dec. 15.. | 5 | • . . | 77 | 73 | 80 | 57 | .. | 100 | 97 | ... | 87 | 97 | 100 | 77 | 100 | 89 |
3 | .... | 80 | 67 | 80 | 53 | .. | 87 | 90 | .. | 67 | 93 | 87 | 57 | 100 | 83 | |
2 | • ■ • . | 73 | 60 | 70 | 47 | .. | 70 | 70 | .. | 70 | 73 | 83 | 37 | 97 | 75 | |
1 | 67 | 47 | 60 | 40 | .. | 57 | 53 | .. | 70 | 77 | 77 | 47 | 90 | 68 | ||
1918. | ||||||||||||||||
Jan. 5.. | 5 | 97 | 93 | 97 | 97 | 57 | 100 | .. | .. | 67 | 83 | 93 | .. | 70 | 93 | 93 |
3 | 77 | 80 | 90 | 70 | 47 | 100 | .. | .. | 67 | 83 | 87 | .. | 67 | 97 | 83 | |
2 | 63 | 77 | 73 | 67 | 60 | 77 | .. | .. | 57 | 63 | 67 | .. | 70 | 90 | 71 | |
1 | 67 | 80 | 67 | 60 | 53 | 57 | .. | .. | 60 | 50 | 77 | • . . | 57 | 73 | 68 | |
Normal av... | 5 | 88 | 84 | 81 | 91 | 60 | 100 | 93 | 93 | 67 | 84 | 93 | 98 | 68 | 99 | 90 |
3 | 79 | 85 | 78 | 73 | 54 | 100 | 74 | 85 | 67 | 74 | 88 | 93 | 48 | 99 | 82 | |
2 | 69 | 75 | 63 | 69 | 61 | 77 | 67 | 67 | 57 | 54 | 71 | 87 | 46 | 71 | 72 | |
1 | 58 | 63 | 53 | 53 | 48 | 57 | 48 | 48 | 60 | 55 | 66 | 70 | 37 | 83 | 62 | |
Jan. 13.. | 5 | 93 | 80 | 97 | 100 | .. | 100 | 97 | .. | 50 | 90 | 93 | 100 | 83 | 100 | 94 |
3 | 87 | 80 | 83 | 80 | .. | 100 | 73 | .. | 40 | 93 | 100 | 87 | 60 | 97 | 87 | |
2 | 83 | 60 | 63 | 87 | .. | 90 | 60 | .. | 50 | 70 | 80 | 53 | 57 | 93 | 72 | |
1 | 60 | 50 | 50 | 47 | .. | 70 | 57 | ... | 53 | 57 | 53 | 63 | 73 | 87 | 58 | |
Jan. 19.. | 5 | 100 | 90 | 87 | 83 | .. | 100 | 83 | 73 | 90 | 97 | 93 | 80 | 100 | 91 | |
3 | 90 | 100 | 73 | 73 | .. | 100 | 70 | .. | 37 | 80 | 97 | 97 | 80 | 100 | 87 | |
2 | 70 | 60 | 50 | 67 | .. | 83 | 50 | ... | 43 | 43 | 80 | 67 | 83 | 100 | 65 | |
I | 63 | 57 | 60 | 47 | .. | 63 | 50 | .. | 37 | 60 | 70 | 43 | 53 | on | 60 | |
Jan. 27.. | 5 | 100 | 97 | 80 | 90 | .. | Do 100 | 93 | .... | 60 | 97 | 100 | 100 | 90 | 100 | 95 |
3 | 90 | 90 | 77 | 70 | .. | 93 | 40 | .. | 50 | 77 | 90 | 93 | 60 | 100 | 81 | |
2 | 77 | 83 | 63 | 63 | .. | 93 | 47 | .... | 40 | 53 | 73 | 73 | 43 | 77 | 68 | |
1 | 70 | 67 | 63 | 50 | .. | 70 | 57 | .. | 43 | 43 | 80 | 70 | 57 | 60 | 62 | |
Low-diet av... | 5 | 98 | 89 | 88 | 91 | ... | 100 | 91 | .. | 61 | 92 | 97 | 98 | 84 | too | 93 |
3 | 89 | 90 | 78 | 74 | .. | 98 | 61 | ... | 42 | 83 | 96 | 92 | 67 | 99 | 85 | |
2 | 77 | 68 | 59 | 72 | . • • • | BO | 52 | .. | 44 | 55 | 78 | 64 | 61 | 90 | 68 | |
1 | 64 | 58 | 58 | 48 | .. | 68 | 55 | ... | 44 | 53 | 68 | 59 | 61 | 79 | 60 | |
1Besides McM, Kim, Mae, and Sch, subject Van is also excluded from this average, as he shows low and irregular values.
Continue to:
My Books

