Transition Pulse. Part 3
Description
This section is from the book "Human Vitality And Efficiency Under Prolonged Restricted Diet", by Francis G.BENEDICT, Walter R. Miles, Paul Roth, And H. Monmouth Smith. Also available from Amazon: Human Vitality and Efficiency Under Prolonged Restricted Diet.
Transition Pulse. Part 3
While recognizing the difficulty of selecting a value that would represent the normal pulse-cycle duration for the period of standing preceding walking, due to the psychical disturbance and the shortness of the preliminary standing record, we have nevertheless attempted to make such a selection and find that the pulse-cycle durations while standing were approximately as follows: Fis, 1.13; Ham, 1.08; Har, 1.19; How, 0.95; Kim, 0.95; Liv, 1.36; Sch, 1.47; Sne, 1.00; Tho, 1.15; Van, 1.48; and Wil, 1.26. Using these figures as a base line, we find that the change to the first peak of the shortened cycles during walking ranged from 0.05 second for How to 0.53 second for Sch, the average change for the squad being 0.29 second. If these standing pulse cycles are compared with those obtained from the pulse-rates plotted for the sixth and twenty-fourth minutes of walking, it is found that after 6 minutes of walking there has been a change which on an average for the squad would correspond to a shortening in the duration of the pulse cycle equivalent to 0.25 second, while for 24 minutes the change would correspond to 0.30 second.
The average durations of the pulse cycles during the few seconds of walking preceding standing as shown by the curves are as follows: Fis, 0.76; Ham, 0.84; Har, 0.85; How, 0.83; Kim, 0.78; Liv, 1.02; Sne, 0.80; Tho, 1.18; Van, 0.94. At the tenth, twentieth, and thirtieth cycles for standing after walking, the durations of the pulse cycles have lengthened from these figures, on an average for the squad, 0.06, 0.07, and 0.02 second, respectively. When the durations at the same three points are compared with the average standing duration preliminary to walking, we find a shorter duration in the post-walking period, the differences being 0.19, 0.18, and 0.19 second, respectively.
Transition Pulse, Squad A
Figures 98 to 100 give the series obtained with Squad A on February 3, 1918, after a long-continued period of restricted diet. The first curve, that of Bro (figure 98), shows the usual change in length of the pulse cycle on the first intimation that the treadmill was to start, which persisted for 8 beats and then gradually lengthened so that at the transition point the pulse cycle was again at its normal length of 0.88 second. As soon as the walking began the duration of the cycle change , and at the fourth beat had shortened to 0.75 second. A slight lengthening followed, so that the duration of the tenth cycle was 0.79 second. The main lengthening, however, took place between the eighteenth an twenty-sixth cycles, when the duration of the pulse cycle changed from 0.74 to 0.88 second. The length of the cycle gradually grew less from this point until the end of this part of the record, but at no time did it become as short as at the first stimulus of walking. In passing from walking to standing, no marked tendency is indicated for a lengthening of the pulse cycle, until after the twentieth cycle, when the duration changed from 0.79 to 0.86 second at the twenty-sixth beat. After shortening again to 0.81 second at the thirtieth cycle, the duration changed to 0.90 second at the end of the record. The character appears, then, to be the same as in the curves discussed, but with the changes in the cycle lengths slightly delayed. The curve on the whole is more uniform than the others in the group which follow it.
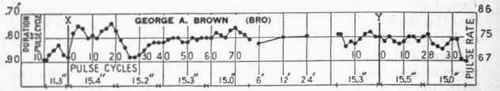
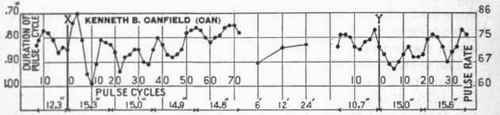
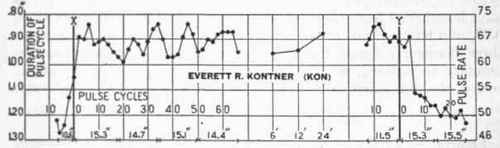
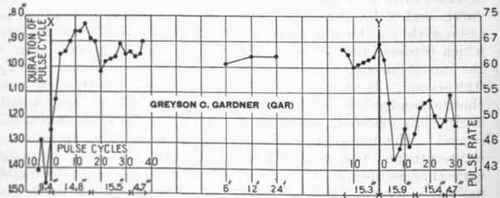
Fig. 98. - Transition pulse curves for Brown, Canfield, Kontner, and Gardner, Squad A, February 3, 1918.
For detailed explanation, see figure 05.
The curve of Can (figure 98) shows a fall at the fourth beat following the initial rise as walking began, but the whole curve has more or less a succession of waves, indicating a rhythm in the pulse-cycle duration. An inspection of the intervals of these waves and of Can's respiration rate shows no relation between these two factors. This rhythm is likewise apparent in the transition curve of standing following walking. In this curve the changes in the duration of the cycle appear, which have been noted with other subjects, but the lengthening of the pulse is not persistent as with most of the other standing curves, and by the end of the record at 30.6 seconds the duration of the cycles is as short as during the walking period.
The curve of Kon for walking (figure 98) shows rather large fluctuations in the length of the pulse cycle. The duration lengthens after the sixth beat, and the following cycles show some indications of periodicity. There is absent here the tendency to a permanent shortening of the duration of the pulse cycle. The final transition shows a sharp change from the walking rate without the tendency to return temporarily to the shorter cycle. By the end of the record, at the twenty-sixth cycle, the duration is 1.23 seconds, or the same as the preliminary standing pulse.
In the curve of Gar (figure 98) only 35 seconds of the walking transition are shown, but the lengthening of the pulse cycle after the first reaction to walking is seen between the fourteenth and the twentieth cycles, when the duration changed from 0.83 to 1.02 seconds. Following this there is indicated the usual tendency to a permanent shortened duration of the pulse cycle. Gar's curve shows an especially marked change at the initial transition, and the same is seen again at the final transition, where it changed from 0.91 to 1.36 seconds in six cycles. There is here seen also the rebound, reaching 1.13 seconds for the twentieth cycle after the walking ceased.
Continue to:
My Books

