


Changes In Pulse-Rate Occasioned By Short Periods Of Exertion. Part 3
Description
This section is from the book "Human Vitality And Efficiency Under Prolonged Restricted Diet", by Francis G.BENEDICT, Walter R. Miles, Paul Roth, And H. Monmouth Smith. Also available from Amazon: Human Vitality and Efficiency Under Prolonged Restricted Diet.
Changes In Pulse-Rate Occasioned By Short Periods Of Exertion. Part 3
For Squad B records were taken on two normal dates, November 18 and December 16, and on two of the low-diet dates, January 14 and January 20. (See table 95.) The averages at the right-hand of the table do not include the values for McM, Kim, and Sch. The other 10 men show averages for November 18 of 94, 67, and 70, for conditions of quiet, activity, and rest, respectively. In per cent of the pulse-cycle length during quiet, the activity and rest are 71.3 and 74.2, respectively. The average pulse-cycle length for the two normal dates and for the three conditions in the records, as shown in the right-hand column of table 95, are 92, 67 and 70, the latter two values being 72.8 and 76.1 per cent, respectively, of the pulse-cycle length during quiet. The individual subjects show no marked peculiarity, except in the comparison of the pulse-cycle lengths for activity and rest. During the 20 beats in the rest following the activity five of the subjects, Fis, How, Lon, Liv, and Wil, have pulse-cycles as short as or shorter than during the activity. In other words, after the activity the pulse tended to remain high for a period. Thus we have a difference between the conditions of activity and rest (72.8 and 76.1) of only 3.3 per cent in the case of Squad B, while with Squad A the resting pulse-cycle length was 7.4 per cent longer than the cycle length during activity. In the average for the two low-diet experiments, several Squad B men show the same condition, that is, a faster pulse following the activity. Hence it can not be assumed that the contrast between the normal of Squad B and the records of Squad A is due to the reduced diet.
Table 95. - Different Levels Of Pulse-Cycle Length With Conditions Of Quiet, Activity, And Rest For Men Of Squad B
[Values in 0.01 second for pulse-cycle length].
Experiment and condition. | Fis. | Har. | How. | Ham. | McM. | Kim. | Lon. | Sch. | Liv. | Sne. | Tho. | Van. | Wil. | Av. | P.ct. | |
Normal: | ||||||||||||||||
Nov. 18 | Quiet. . | 101 | 93 | 68 | 82 | 82 | .. | 108 | .. | 99 | 84 | 112 | 98 | 96 | 94 | 100 |
Active. | 74 | 68 | 58 | 61 | 67 | ... | 81 | .. | 73 | 58 | 69 | 61 | 71 | 67 | 71.3 | |
Rett... | 73 | 68 | 59 | 69 | 63 | .. | 75 | .. | 69 | 70 | 76 | 74 | 64 | 70 | 74.5 | |
Dec. 16 | .. | 91 | 67 | ..... | 88 | ... | 108 | 60 | 101 | 83 | .. | 93 | 90 | 90 | 100 | |
Active. | .. | 70 | 57 | .. | 67 | .. | 79 | 51 | 72 | 58 | ... | 63 | 71 | 67 | 74.4 | |
Rest... | .. | 72 | 56 | .. | 76 | .. | 81 | 54 | 68 | 66 | .. | 76 | 69 | 70 | 77.8 | |
Normal average: | ||||||||||||||||
Quiet... | 101 | 92 | 68 | 82 | .. | .. | 108 | .. | 100 | 84 | 112 | 96 | 93 | 92 | 100 | |
Active... | 74 | 69 | 58 | 61 | .. | ... | 80 | .. | 73 | 58 | 69 | 62 | 71 | 67 | 72.8 | |
Rest......... | 73 | 70 | 58 | 69 | .. | .. | 78 | .. | 69 | 68 | 76 | 75 | 67 | 70 | 76.1 | |
Per cent change: | ||||||||||||||||
Active... | 73.3 | 75.0 | 85.3 | 74.4 | ... | .. | 84.0 | .. | 73.0 | 69.0 | 61.6 | 64.6 | 76.3 | 72.8 | .. | |
Rent......... | 72.3 | 76.0 | 85.3 | 84.2 | .. | .. | 72.1 | . | 69.0 | 81.0 | 67.8 | 78.1 | 72.0 | 76.1 | .. | |
Low-diet: | ||||||||||||||||
Jan. 14 | Quiet... | 104 | 98 | 81 | 91 | .. | 97 | 109 | 105 | 118 | 80 | 130 | 122 | 103 | 104 | 100 |
Active. | 75 | 78 | 59 | 65 | .. | 71 | 85 | 68 | 79 | 59 | 98 | 72 | 78 | 75 | 72.1 | |
Rest... | 76 | 67 | 55 | 62 | .. | 80 | 72 | 72 | 89 | 57 | 95 | 85 | 72 | 73 | 70.2 | |
Jan. 20 | Quiet. . | 105 | 115 | 87 | 89 | .. | 93 | 103 | 136 | 115 | 100 | 115 | 113 | 101 | 104 | 100 |
Active. | 75 | 77 | 78 | 73 | .. | 73 | 86 | 83 | 74 | 67 | 80 | 67 | 78 | 76 | 73.1 | |
Rest... | 79 | 83 | 72 | 76 | .. | 76 | 82 | 90 | 79 | 66 | 95 | 89 | 81 | 80 | 76.9 | |
Low-diet av'g: | ||||||||||||||||
Quiet......... | 105 | 107 | 84 | 90 | ... | 95 | 106 | 121 | 117 | 90 | 123 | 118 | 102 | 104 | 100 | |
Active....... | 75 | 78 | 69 | 69 | .. | 72 | 86 | 76 | 77 | 62 | 89 | 70 | 78 | 76 | 73.1 | |
Rest......... | 78 | 75 | 64 | 69 | .. | 78 | 77 | 81 | 84 | 62 | 95 | 87 | 77 | 77 | 74.0 | |
Per cent change: | ||||||||||||||||
Active... | 71.4 | 72.9 | 82.2 | 76.6 | ... | 75.8 | 81.2 | 62.9 | 65.8 | 70.0 | 69.5 | 59.3 | 76.4 | 73.0 | • • • • • | |
Rest......... | 74.3 | 70.1 | 76.2 | 76.6 | ... | 82.1 | 72.6 | 67.0 | 71.8 | 68.9 | 74.2 | 73.7 | 75.4 | 74.0 | .. | |
The average quiet, activity, and rest values with the percentage of change from the quiet as shown by activity and rest are, for comparison, summarized in table 96. In this are embodied, also, the results of normal series of 1917. Records, usually two for each man, obtained with 63 normal aviation candidates enter into this 1917 series. The technique employed with these men was identical with that used in this investigation and described on page 151, except that the first trial was not a practice trial without a record, as in the low-diet investigation, but with the aviators a record was taken. Thus the pulse-rate in the first record for the aviators was affected somewhat by the factor of excitation and novelty. It is possible that this in large part accounts for the difference between their average of 83 for the quiet pulse-cycle length and 92 for the normal average of the same measurement with Squad B, and likewise for the fact that the activity and rest values, 60 and 65, are shorter than the normal values of Squad B, i. e., 67 and 70. However, both the normal values for Squad B and those in the series of 1917 definitely show shorter pulse-cycle lengths than the values for the low-diet period of Squad B and those of Squad A. Compared on the basis of percentage of change of the activity over the pulse-cycle length during quiet, we have for Squad A 29 per cent and for all the others 27 per cent - surely a remarkably close correspondence. The percentage of change in the 20 pulse-cycles following activity, as compared to the quiet pulse-cycle length, is for Squad A 22 per cent, while that for the normal series of 1917 is 21 per cent. With Squad B, also, the low-diet value is 1 per cent larger than the normal, being 26 per cent as compared with 25 per cent. As was mentioned earlier, certain of the members of Squad B demonstrated individual peculiarities, having a faster pulse than would normally be expected after activity.
Table 96. - Summary For Pulse Changes Occasioned By Short Periods Of Exertion
[Values in 0.01 second for pulse-cycle length].
Groups of subjects and conditions compared. | Quiet. | Activity. | Rest. | Activity, p. ct. of change. | Rest, p. ct. of change. |
Squad A, low-diet... | 109 | 77 | 85 | 29 | 22 |
Squad B, normal... | 92 | 67 | 70 | 27 | 25 |
Squad B,low diet... | 104 | 76 | 77 | 27 | 26 |
Normal series of 1917.. | 83 | 60 | 65 | 27 | 21 |
Finally, we may compare the composite curves, which show not simply the levels in the three different conditions, quiet, activity, and rest, as presented and discussed in tables 94, 95, and 96, but also demonstrate the transitions and the progressive changes between these. An average was made for the comparable pulse-cycles of the 10 subjects of Squad A for three of the dates on which such tracings were taken for these men.1 The average values obtained for these dates, together with a similar average obtained for all of the records of the 63 men of the series of 1917, are plotted in curves and embodied in figure 93. A similar series of curves for Squad B, together with the average for the series of 1917, are presented in figure 94. As explained on page 416, two records, such as are illustrated in figure 24, were taken for each subject and date; therefore, as 10 subjects are averaged, each plotting-point is usually the average length of 20 pulse-cycles. The 6 pulse-cycles immediately preceding the beginning of activity were used to indicate the level of the quiet pulse. The first 20 cycles following the end of activity were taken as indicative of the changes in the period of rest after exertion. Since in our procedure the duration of activity was made as constant as practicable, the number of pulse-cycles which came within this limit was naturally a function of the pulse-rate and varied with different subjects. This, unfortunately, when one averages the records, causes an irregularity at the point of transition from activity to rest. In figure 93 the curves for Squad A show an irregular rise at this point due to the predominating influence of these faster pulse-rates. (See Gul and Tom, table 94).
1 We have omitted from the average the records of Kon and Spe.
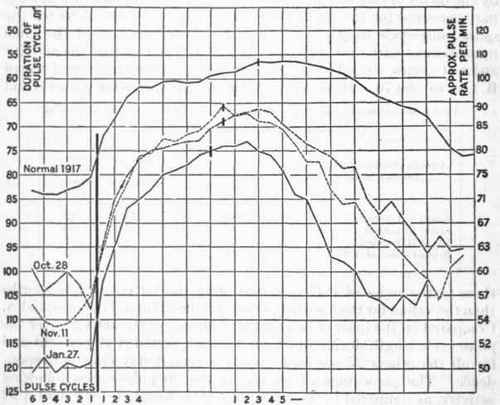
Fig. 93. - Composite curves for changes in pulse-cycle duration with exertion, Squad A - Records for 3 days with Squad A compared with the results for normal series of 1917.
In all of the curves for Squads A and B, the major portion of the period of activity and also of the period of subsequent rest have a very great uniformity, that is, the averages make very smooth curves. There is apparently no significant difference with Squads A, B, and the normal series of 1917 in the sharpness of the rise with beginning activity. The absolute change in hundredths of a second between the level for quiet and the level for activity is of course greater in those cases in which the level for quiet is low, as for example, on January 27 with Squad A (fig. 93), but, as we have seen previously, the percentage of change is about the same in each case. The irregularity at the beginning during the period of quiet is somewhat larger than would be expected, judging from the curve for the series of 1917. These irregularities, considered on the percentage basis, would not be as relatively large as they appear in the figure. It seems probable that at the lower pulse-rate the natural arrhythmia is accentuated. The descending portion of the curves is usually consistent in its uniformity until it reaches approximately the sixteenth pulse-cycle. Subsequently there is considerable fluctuation. From figure 93 it would appear that the return in the direction of the basal level for quiet is more prompt for Squad A than in the case of the normal series for 1917. If one had only these data it might be taken as an indication of a different condition due to the lower pulse-rate during the reduced diet. When we compare the curves for Squad B, however (see fig. 94), we find no sensible difference in their slope as compared with the normal series of 1917, and the normal curves of Squad B compare very favorably with those taken during the period of reduced diet.
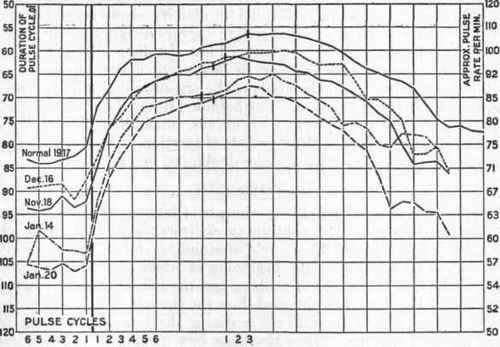
Fig. 94. - Composite curves for changes in pulse-cycle duration with exertion, Squad B - Records for 4 days with Squad B compared with the results for normal series of 1917.
The electrocardiograms taken to show the changes in heart rate due to short periods of general muscular exertion fail to demonstrate any-pathological conditions, judged in the light of the available standards with which we may compare such records. No subject ever complained in connection with the test or asked to be excused or indicated any fatigue following the exercise. The only consistent difference exhibited between the men on reduced diet and those with uncontrolled diet is in the pulse-rate level, irrespective of whether we compare periods of quiet when the subject is relaxed, periods of exertion when the larger part of the voluntary musculature is under tension, or periods of rest following such activity. The percentage of rise in the pulse-rate occasioned by such activity, which is found on the average in the 20 pulse-cycles immediately following the activity, shows no significant change with reduced diet. It therefore appears certain that the lower nutritional level produced by continued low diet did not interfere with the ability for adaptive increase in heart rate under conditions of muscular exertion, when the needs of the organism naturally required an increase in the circulation. Furthermore, it may be stated that no annoying cardiac or respiratory symptoms, other than the described normal changes, followed these periods of exertion. In all the records there were no cases of extra systoles or skipped beats.
Continue to:


My Books

